Task 1: Visualisation Diagram
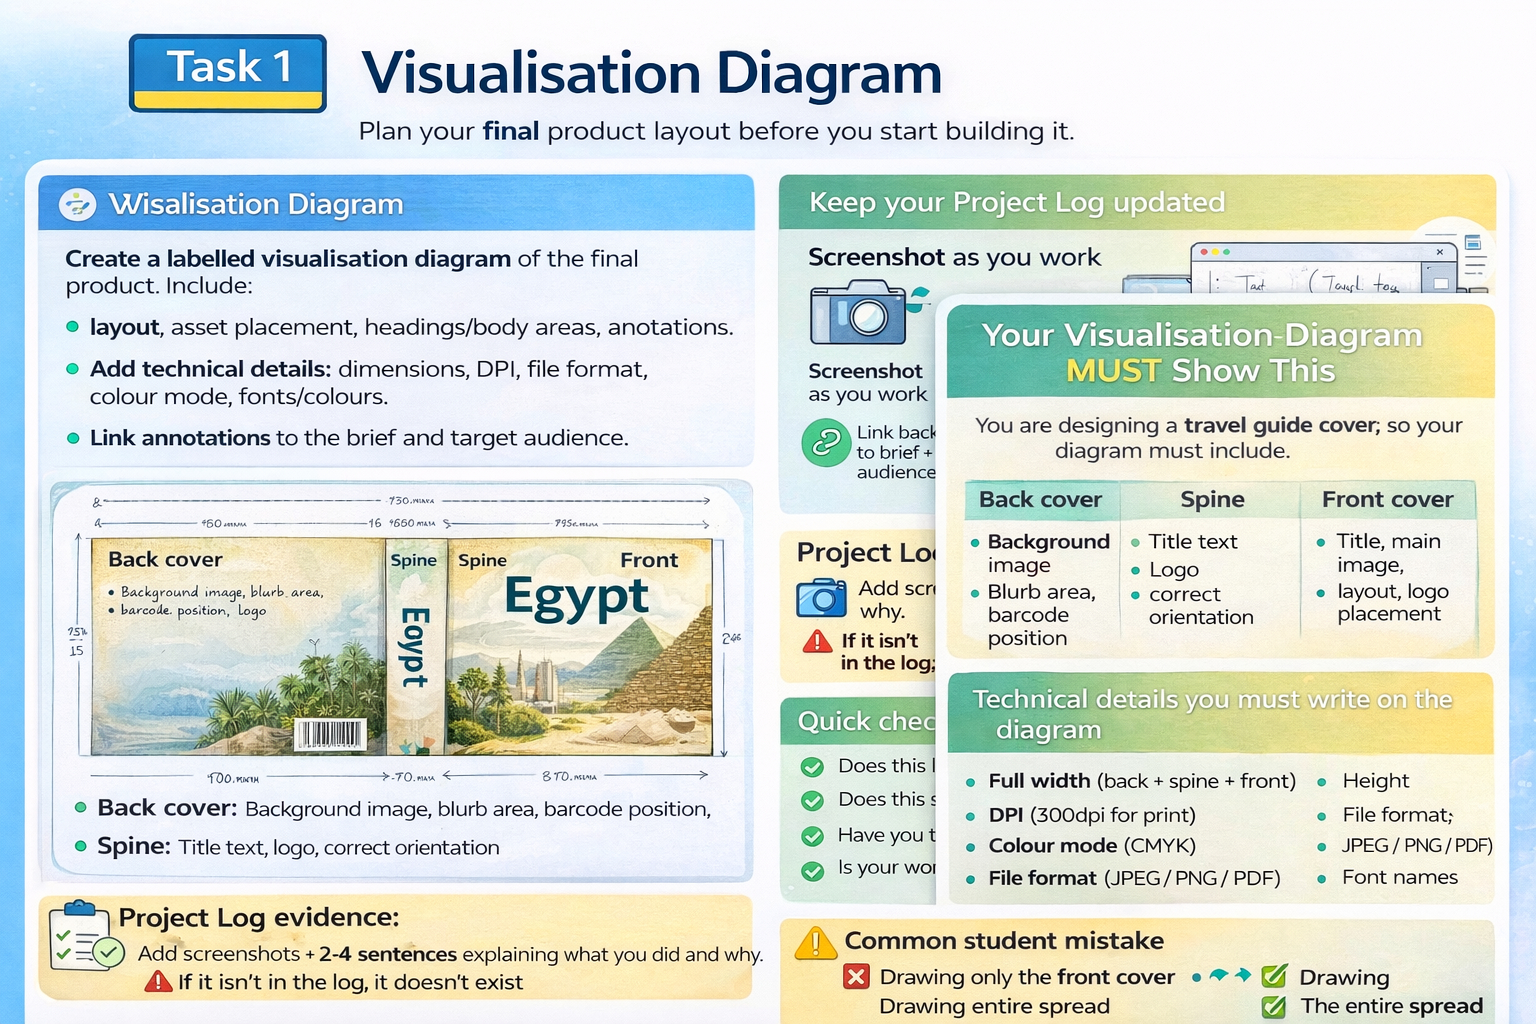
Plan your final product layout before you start building it.
Keep your Project Log updated
Screenshot as you work
Link back to brief + audience
Visualisation Diagram
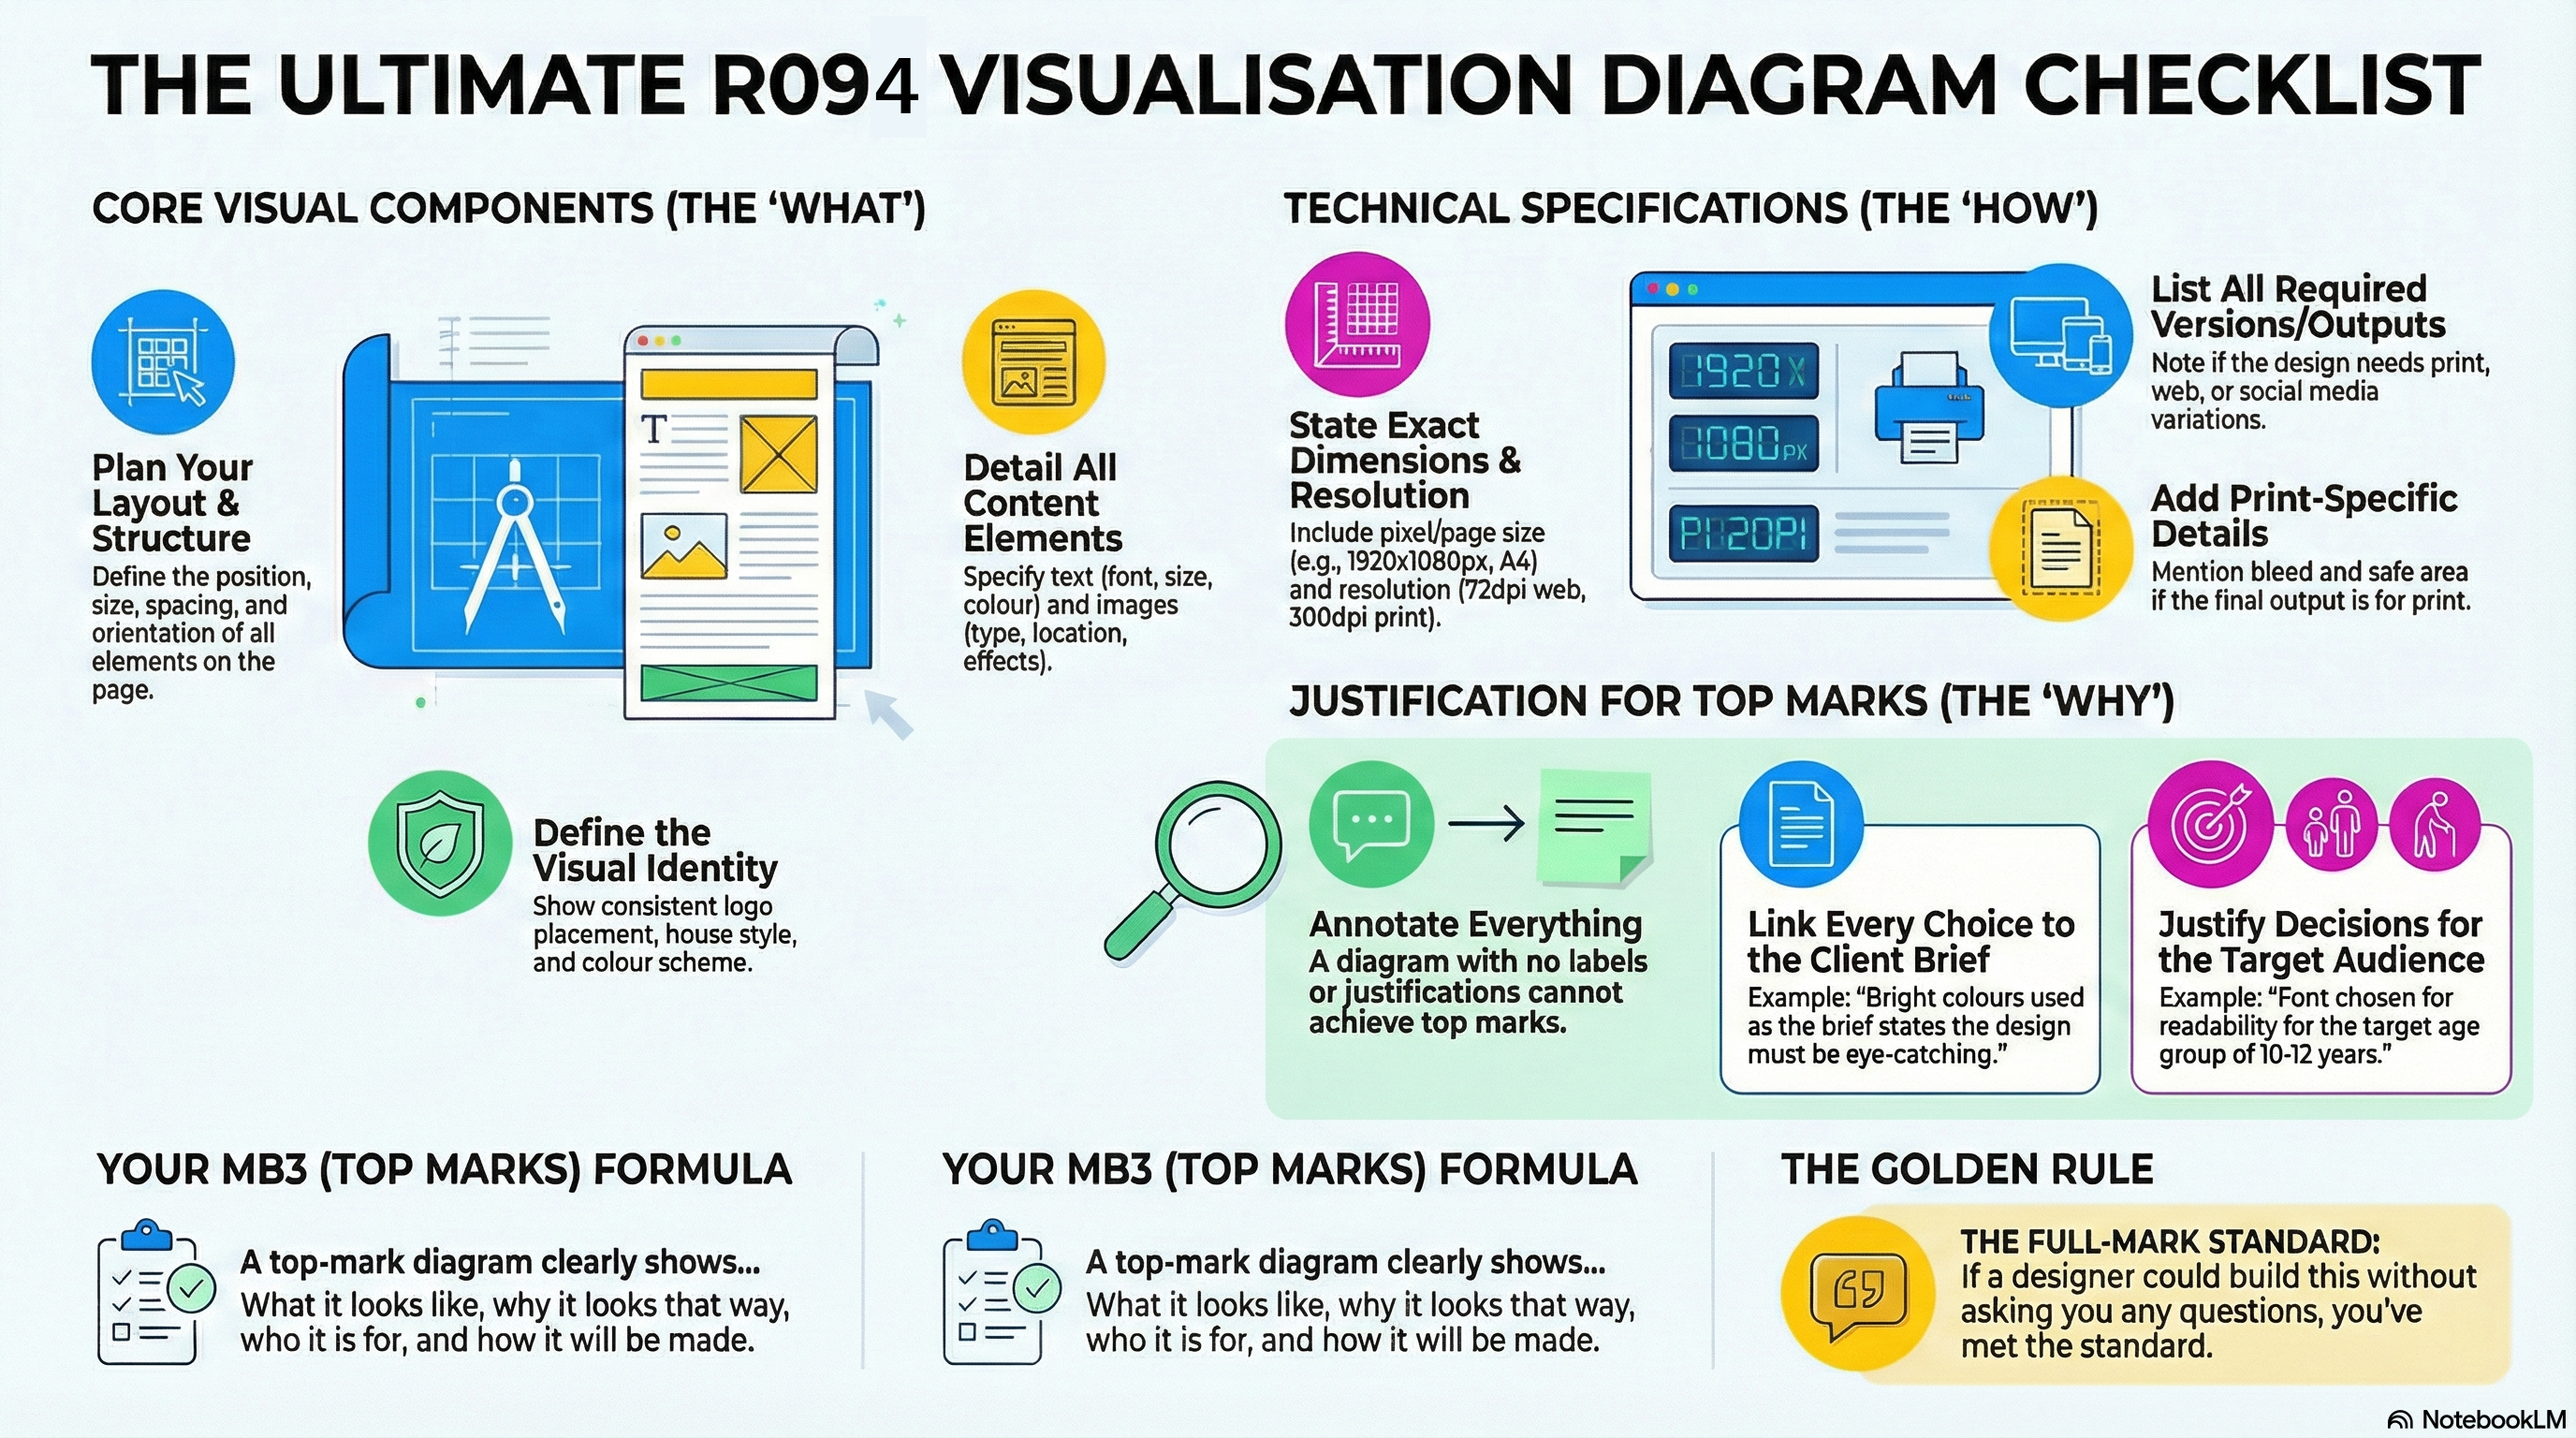
- Create a labelled visualisation diagram of the final product.
- Include: layout, asset placement, headings/body areas, annotations.
- Add technical details: dimensions, DPI, file format, colour mode, fonts/colours.
- Link annotations to the brief and target audience.
Project Log evidence:
Add screenshots + 2–4 sentences explaining what you did and why. If it isn't in the log, it doesn't exist.
Quick checks
- Does this link back to the client brief?
- Does this suit the target audience?
- Have you taken screenshots during the process?
- Is your work saved in the correct folder (Task 1 / Task 2)?
Common mistake:
Only adding the final outcome. Marks come from your process and explanations.
Visualisation Diagram Checklist